Today one of our clients had a server with 16GB of RAM that had almost no software on it but was completely max’ed on memory. They did a quick calculation and found that the PROCESSES tab in Task Manager totaled to about 4GB. They wanted to know where the other 12GB went to, and we suppose an awful lot of people are confused by this as well so we decided to write this explanation.
1 – PAGED POOL
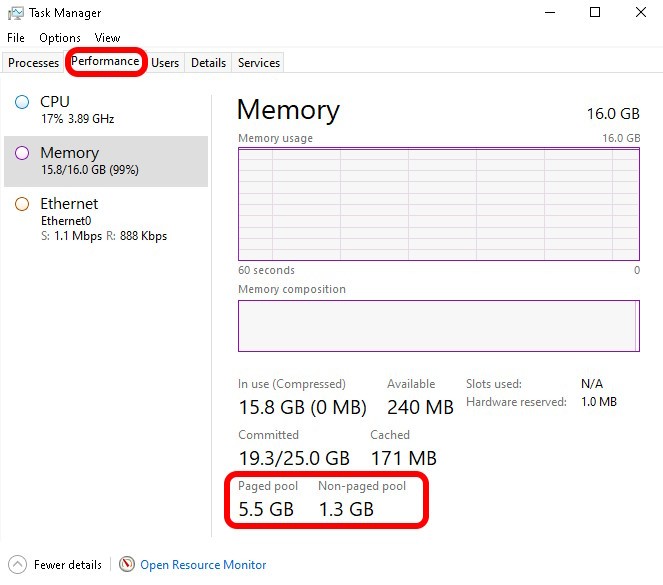
The discrepancy in memory usage shown in Task Manager is because your computers RAM memory is used by much more than just “Processes” from running programs and services. The most notable use of RAM is often the PAGED POOL and NON-PAGED POOL memory, shown on the PERFORMANCE tab. In our case that accounted for nearly 7GB of the 16GB, which is NOT included in Task Manager Processes:
2 – RAM PAGE TABLE
There is also the Memory Page Table, which keeps track of what each block of memory has stored in it. Of course this RAM Page Table, is stored, in memory and is often a few hundred MB.
4 – HIDDEN PROCESSES
Then there are hidden processes that Task Manager cannot see like:
- Session Manager Subsystem (smss.exe): This is a critical system process responsible for handling sessions and initializing the system environment. It’s usually hidden to prevent accidental termination.
- Client/Server Runtime Subsystem (csrss.exe): This process is essential for the graphical subsystem and is often hidden to protect system stability.
- Windows Logon Application (winlogon.exe): This process handles user logins and logouts. It’s hidden to ensure the security and integrity of the login process.
- Service Host (svchost.exe): This is a generic host process for services that run from dynamic-link libraries (DLLs). Multiple instances of svchost.exe can run simultaneously, and some might be hidden to manage system resources efficiently.
- Malware: Virus’ often try to run as hidden processes.
4 – CACHED MEMORY:
Memory used for caching data can also cause discrepancies. Cached memory is data / files that the computer keeps in memory even though it is not currently needed. Intel hardware can memory cache and Windows “SuperFetch” are both used to speed up access to frequently used data and might not be reflected in the memory usage of individual processes.
5 – SYSTEM OVERHEAD:
The operating system itself uses memory for various tasks, including the OS Kernel is not directly attributed to specific processes.
HOW TO SEE EVERYTHING USING MEMORY
We like to use RamMap from Sysinternals to see what is really happening with our RAM memory. You can download RamMap for free directly from Microsoft HERE.

RamMap does not update automatically and will take a few seconds to make its investigations and display the results.
If you want to to see what is happening to your memory as it is happening, you can use tools like Resource Monitor or specific PowerShell commands:
Get Total Memory Usage
$os = Get-WmiObject -Class Win32_OperatingSystem
$totalMemory = $os.TotalVisibleMemorySize
$freeMemory = $os.FreePhysicalMemory
$usedMemory = $totalMemory - $freeMemory
$usedMemoryPercentage = [math]::round(($usedMemory / $totalMemory) * 100, 2)
Write-Host "Total Memory: $($totalMemory / 1MB) MB"
Write-Host "Used Memory: $($usedMemory / 1MB) MB ($usedMemoryPercentage%)"
Get Detailed Memory Usage
Get-Process | Sort-Object -Property WorkingSet -Descending | Select-Object -First 10 Id, ProcessName, @{Name="Memory (MB)";Expression={[math]::round($_.WorkingSet / 1MB, 2)}}Get Physical Memory Details
Get-CimInstance -ClassName CIM_PhysicalMemory | Select-Object Manufacturer, Capacity, Speed, PartNumber
Get Memory Usage Over Time
while ($true) {
    Get-Process | Sort-Object -Property WorkingSet -Descending | Select-Object -First 10 Id, ProcessName, @{Name="Memory (MB)";Expression={[math]::round($_.WorkingSet / 1MB, 2)}}
    Start-Sleep -Seconds 5
}


0 Comments